The attractions industry continues to evolve, and the newly released 2025 TEA Global Experience Index (now in its landmark 20th annual edition) provides an indispensable snapshot of global attendance, trends, and market strategies across the sector.
Published by the Themed Entertainment Association (TEA) in partnership with Storyland Studios, Entertainment + Culture Advisors (ECA), The Park Database, Moongate Design Studio, and InPark Magazine, the report documents a transformative phase for theme parks worldwide.
Across the board, the 2025 data points to a broader structural shift: operators are moving away from relying strictly on gate turnstile counts and are instead focusing on total destination ecosystems. By integrating flagship anchor attractions with hotels, dining, retail, special events, and intellectual property (IP) expansions, operators are maximizing dwell time, driving per-capita spending, and renewing mature markets.
Here are the key takeaways and regional performance metrics for theme parks and amusement parks from this year’s Index.
1. Global Headline Figures: A Flat Top Line Belies Dynamic Regional Shifts
Attendance across the world’s top 25 leading theme parks was essentially flat in 2025 at 245.4 million visits, representing a nominal decline of 0.2% compared to 2024’s 245.9 million.
Global Top 10 Operator Groups
In terms of parent group performance, Disney Experiences retained its top position worldwide with 146.9 million visits (+1.1%). Universal Destinations & Experiences posted the strongest growth among top-tier operators, rising 5.4% to 62.1 million visits and overtaking Merlin Entertainments for third place globally.
| Rank | Operator Group | 2025 Attendance |
|---|---|---|
| 1 | Disney Experiences | 146,853,000 |
| 2 | Fantawild Group | 85,016,000 |
| 3 | Universal Destinations & Experiences | 62,138,000 |
| 4 | Merlin Entertainments | 60,500,000 |
| 5 | Six Flags Entertainment Corporation | 47,388,000 |
| 6 | Chimelong Group | 40,393,000 |
| 7 | Overseas Chinese Town (OCT Group) | 39,360,000 |
| 8 | Haichang Group | 22,723,000 |
| 9 | United Parks & Resorts | 21,200,000 |
| 10 | Herschend | 20,000,000 |
Note: Six Flags Entertainment Corporation completed its first full year following its merger with Cedar Fair, focusing heavily on portfolio rationalization and selective capital allocation. Herschend entered the top 10 operator rankings for the first time.
2. Regional Analysis: How Theme Parks Performed Worldwide
The Americas: Universal Epic Universe Reshapes Central Florida
- North America Top 20: Total attendance reached 143.1 million visits (+1.5%).
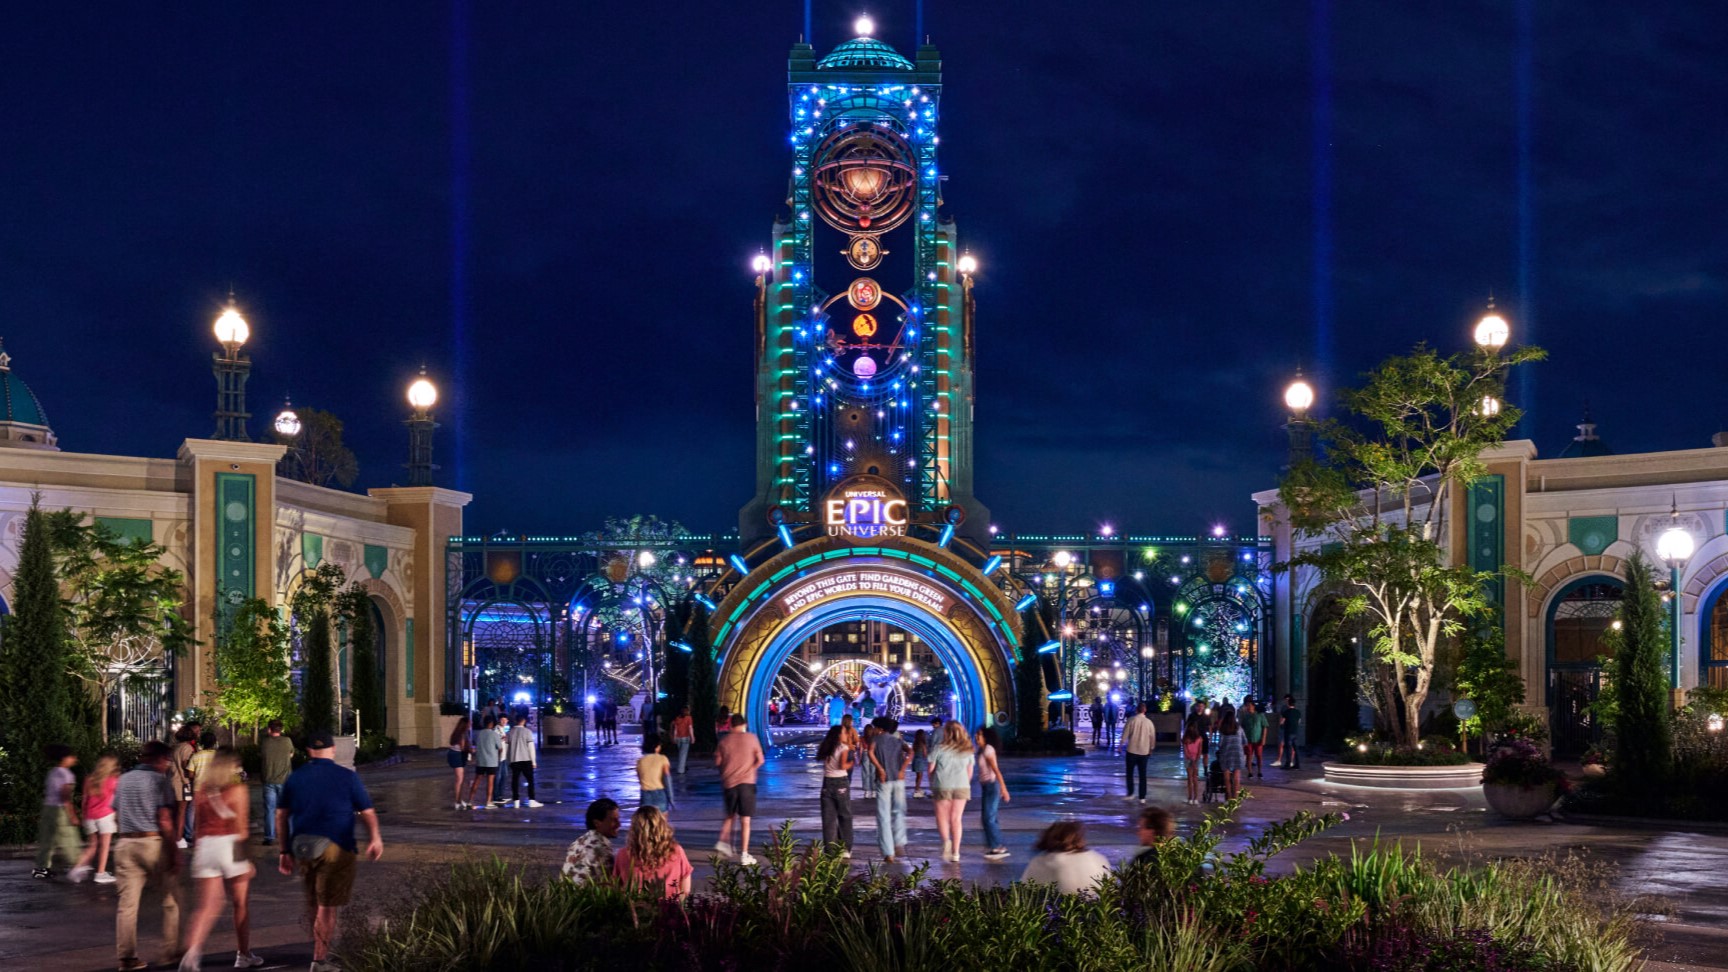
- The Epic Effect: The May 2025 opening of Universal Epic Universe—Orlando's first new mega theme park in over 25 years—drew 4.0 million visits in its partial opening year. While legacy Orlando gates experienced slight single-digit decreases as crowd distribution adjusted, Epic Universe generated a net gain for Universal Orlando Resort (+3.5 million turnstile clicks) and lifted Central Florida’s combined leading theme park attendance by 4.3%.
- Reinvestment & Regional Standouts: Dollywood produced an impressive year, rising 8.1% to 3.4 million visitors following high-profile attraction additions. Meanwhile, Southern California parks faced headwinds, with Universal Studios Hollywood falling 8.0% (to 8.0 million) due to regional wildfire disruptions.
- Latin America Surge (+4.8%): Latin America proved to be a vibrant growth market. Beto Carrero World in Brazil grew 16.0% to 2.9 million visitors, bolstered by new IP partnerships (DreamWorks' Trolls, Hasbro's NERF) and a massive R$2 billion expansion program. Brazil’s Hopi Hari (+11.9% to 1.45 million) also saw major gains following its acquisition by Brooklyn International Group.
Asia-Pacific (APAC): Maturing Core Markets & Emerging IP Hubs
- APAC Top 20: Combined attendance at the region's top 20 parks dipped slightly by 1.2% to 146.0 million visits, signaling a market transitioning from rapid physical buildout to sustainable, quality-driven growth.
- Japan Resilience: Universal Studios Japan led all APAC parks with 16.04 million visits (+0.2%), driven by the December 2024 debut of Donkey Kong Country in SUPER NINTENDO WORLD™ and spillover from Expo 2025 Osaka. Tokyo DisneySea grew 1.3% to 12.6 million in its first full year operating Fantasy Springs.
- China Highlights: Shanghai Disneyland hit a record 15.0 million visits (+2.0%). LEGOLAND Shanghai Resort made its landmark debut in July 2025, welcoming 1.2 million guests in just six months and marking the most successful debut in LEGOLAND history.
- Weather & Demographic Pressures: Outdoor operators in South Korea suffered under extreme summer heatwaves and torrential rains, with Everland falling 15.6% (to 4.7 million) and Lotte World down 4.6% (to 5.05 million), further compounding long-term pressures from a shrinking school-age population.
- Southeast Asia Momentum: Universal Studios Singapore jumped 7.5% to 4.2 million visits following the launch of Minion Land, acting as an anchor within Singapore's multi-faceted tourism master plan.
Europe, Middle East & Africa (EMEA): Short-Break Destination Conversions Drive Growth
- EMEA Top 20: Theme park attendance across EMEA grew 2.9% to 68.7 million visits.
- Disneyland Paris Rebounds: Both Disneyland Park (10.8 million) and Walt Disney Studios Park (5.9 million) surged 5.7% as international tourism normalized following the 2024 Paris Olympics.
- Resort Transformations: European operators experienced strong returns by building multi-day short-break ecosystems. Europa-Park celebrated its 50th anniversary by topping 6.25 million park visitors (and over 7 million across the resort). Alton Towers in the UK grew 13.0% to 2.8 million visitors following the launch of Toxicator. Puy du Fou España soared 21.4% to 1.7 million guests, while Puy du Fou France reached 3.0 million (+7.1%), proving the global strength of immersive, spectacle-based models.
- Middle East Expansion & Challenges: Six Flags Qiddiya City in Saudi Arabia officially opened at the end of December 2025, introducing 28 major rides including the record-breaking Falcon's Flight roller coaster. While 2025 established strong foundations—highlighted by Yas Island's major investments and the announcement of a future Disney resort in Abu Dhabi—regional geopolitical tensions emerging in early 2026 present ongoing monitoring variables for future tourism pipelines.
3. The Big Picture: Strategy Insights for Industry Professionals
The findings of the 2025 TEA Global Experience Index point to clear tactical shifts that will shape attraction design, vendor partnerships, and capital allocation over the coming years:
- The Anchor is Just the Beginning: Standalone gates are increasingly being wrapped into multi-day resort destinations. Developers are building on-site hotel inventory, branded dining, and immersive retail alongside core ride investments to increase dwell time and capture higher per-capita yield.
- Targeted IP Integration: Whether it is Universal’s expansion of Nintendo and Harry Potter IP, Disney’s deployment of Spider-Man and Pixar lands, or Merlin’s localized Chinese storytelling at LEGOLAND Shanghai (e.g., Monkie Kid), recognizable intellectual property remains the fastest catalyst for driving repeat visits.
- Weather Resiliency in Master Planning: With extreme climate events impacting attendance in South Korea, China, and North America, future park designs are increasingly incorporating climate-controlled, indoor, or semi-enclosed elements to stabilize operating days.
- Cross-Sector Convergence: The themed experience economy is widening. Cruising, in particular, has emerged as both a benchmark and competitor. With ocean cruise volume reaching 37.2 million passengers in 2025 (generating 264 million passenger-days) and operators building massive, park-like private island destinations (such as Royal Caribbean’s Perfect Day at CocoCay at 3.5 million annual visits), theme park designers and manufacturers are finding expanding opportunities at sea.
As mature destinations refresh their footprints and emerging markets build out next-generation leisure hubs, the 2025 Index underlines that innovation, immersive storytelling, and destination-wide master planning remain the ultimate growth drivers for the global attractions sector.
The full 2025 TEA Global Experience Index report is available to download via the Themed Entertainment Association (TEA) website.
